
- 13/03/2026
- Posted by: Janick Pettit
- Categories: Articles, Consumer Goods / FMCG, Energy drinks, Non-alcoholic beverages, SagaCube
Energy drinks consumption in Africa and the sector as a whole is growing. Understanding the drivers behind it is increasingly important for brands operating across the continent. This article draws on data collected through SagaCube, Sagaci Research’s consumption tracker, and covers responses from over 548,000 panel members across all 54 African countries.
The survey captures daily drinking habits — what people drank yesterday, when, where, and with whom — and then goes a level deeper to uncover the underlying motivations behind those choices. These need states are key to understanding consumer behaviour and unlocking growth opportunities.
Energy drinks: a small but remarkably consistent footprint across Africa
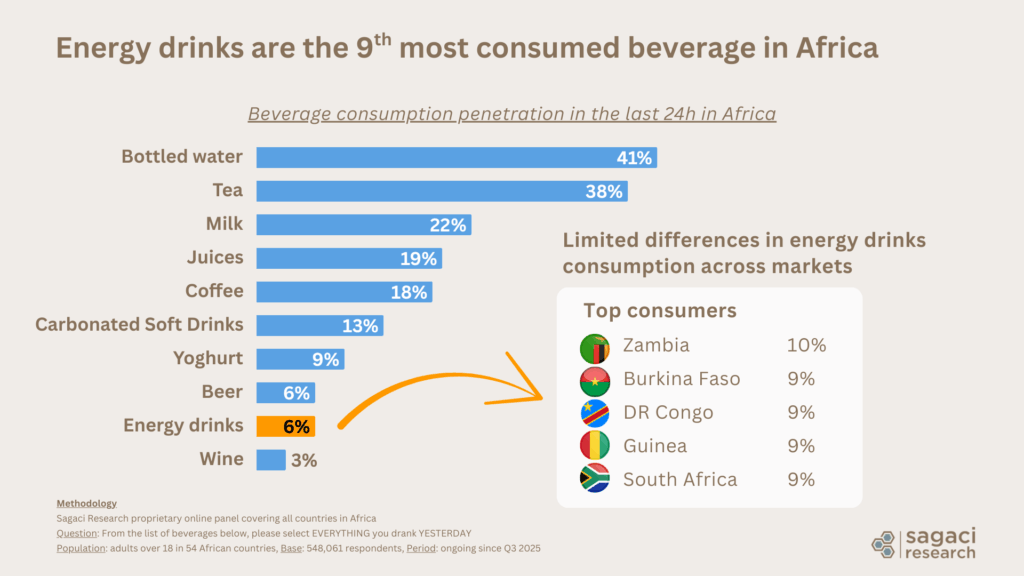
Across all beverages tracked, energy drinks are consumed by 6% of adults on any given day, placing them 9th overall. They sit behind bottled water (41%), tea (38%), milk (22%), juices (19%), coffee (18%) and carbonated soft drinks (13%), at the same level as beer (6%), and ahead of wine (3%).
While the penetration figure may seem modest, the category shows remarkable consistency across markets. The gap between the top and bottom countries is narrow, which suggests that energy drinks have established a baseline presence across the continent rather than being concentrated in a handful of high-income markets.
The top consuming markets are Zambia (10%), Burkina Faso, DR Congo, Guinea, and South Africa (all at 9%). This spread across East, West, Central, and Southern Africa points to an opportunity that is genuinely pan-African, rather than regional.
Flavours and formats: classic leads, but fruit is closing in
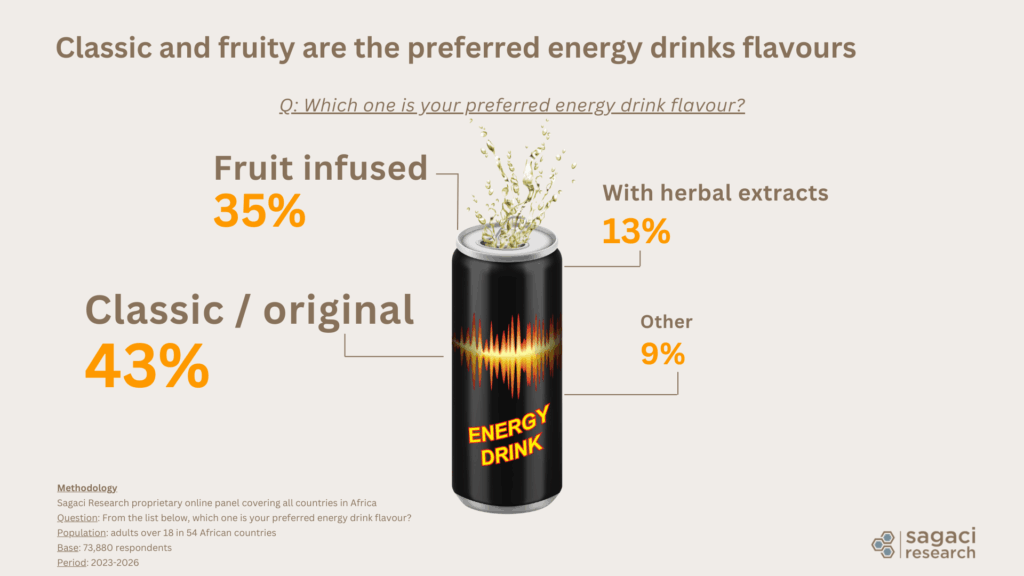
When it comes to flavour preference, classic or original energy drinks remain the top choice at 43%. Fruit-infused variants follow at 35%, while herbal extract options account for 13% and other flavours for 9%.
The strong showing for fruit-infused flavours, especially given the popularity of fruit in beverage categories like juice, suggests real potential for innovation in this space. Brands that can credibly bridge the energy and fruit categories may find a receptive audience.
On format, cans dominate with 51% of product scans recorded via the SagaProduct mobile panel. Plastic bottles are a strong second at 41%, while other formats such as glass bottles and sachets account for the remaining 8%. The sachet format, in particular, is worth monitoring as an affordability-driven alternative in price-sensitive markets.
When, where, and with whom: energy drinks consumption occasions in Africa
Understanding the occasion structure of energy drinks consumption in Africa helps brands make smarter decisions about packaging, distribution, and communication.
When do African consumers drink energy drinks?
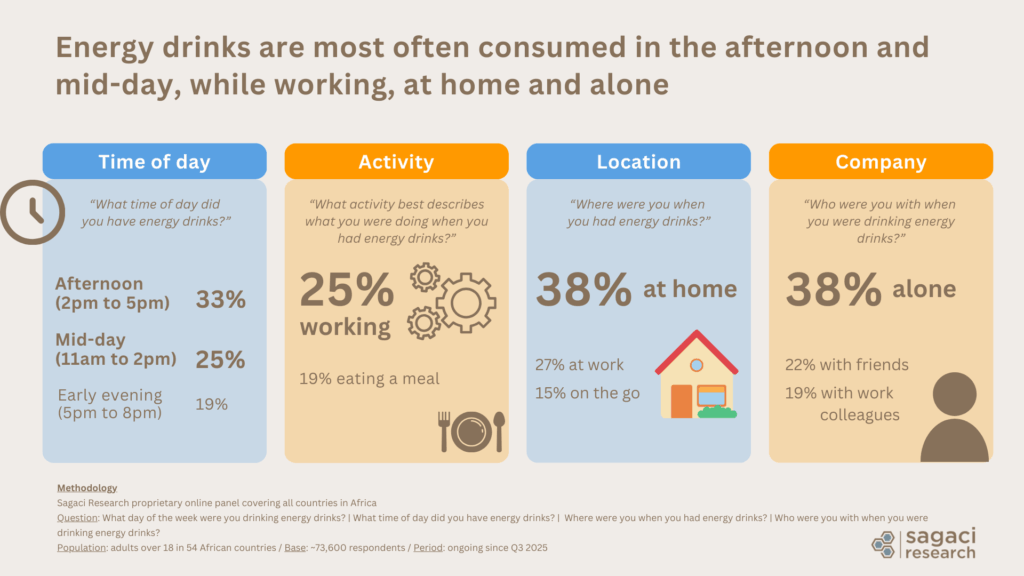
Energy drinks are primarily consumed during the working day. The afternoon (2pm to 5pm) is the leading time slot at 33%, followed by mid-day (11am to 2pm) at 25%, and early evening (5pm to 8pm) at 19%.
This timing pattern aligns closely with productivity-related moments: the post-lunch dip, the mid-afternoon push, and the early evening wind-down. It differs from juice consumption in Africa, which skews more strongly toward mealtime moments, and from carbonated soft drinks, which tend to peak at lunchtime.
Where do African consumers drink energy drinks?
The home is the leading consumption location at 38%, followed by the workplace (27%) and on the go (15%). This dual home/work profile means brands need to think across two distinct distribution and communication contexts: the planned household purchase and the impulse or convenience purchase at or near work.
Who do African consumers drink energy drinks with?
Energy drinks are most often consumed alone (38%), reinforcing their functional, personal-use positioning. That said, social occasions do feature: 22% of consumption occasions happen with friends, and 19% with work colleagues. This social dimension should not be overlooked, particularly for nightlife and out-of-home activations.
What drives energy drink consumption in Africa: the need states
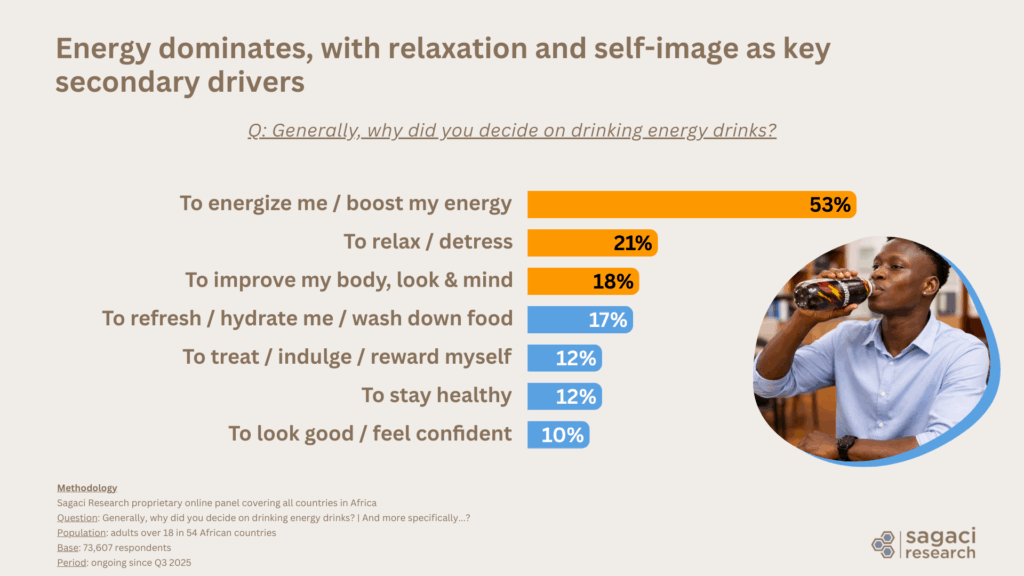
The data identifies a clear hierarchy of motivations. Energizing is the dominant driver by a wide margin, with relaxation and self-improvement as important secondary needs.
Driver #1: Energizing
More than half of energy drink consumers in Africa (53%) say their primary motivation is to boost or restore their energy. Within this top-level need state, three more specific motivations emerge:
- To give an energy boost or ‘pick me up’: 33%
- To provide sustained, long-lasting energy: 17%
- To help me stay focused: 15%
The distinction between instant boost and sustained energy is commercially meaningful. It points to two potentially different product positioning territories: one for quick-hit formats (smaller, more affordable packs) and one for endurance or functional formats aimed at workers, students, or active consumers.
Driver #2: Relaxing
One in five consumers (21%) cites relaxation or de-stressing as their primary reason for choosing an energy drink. This may seem counterintuitive given the category name, but it reflects how some consumers use the ritual of drinking an energy drink, or respond to certain formulations, as a way to restore mental balance.
The deeper motivations here are: calming down or relaxing (8%), restoring balance (6%), and clearing the mind (5%).
Driver #3: Improving body, look and mind
This need state (at 18%) reflects an aspiration for holistic improvement: looking better, feeling stronger, and performing at a higher level mentally and physically. Specific motivations include boosting immunity (6%), sustained energy (4%), and getting going for the day (4%).
This driver connects energy drinks to the broader health and wellness space, a territory that offers opportunities for better-for-you positioning, especially as functional drink formats grow globally.
Driver #4: Refreshing
Refreshment and hydration account for 17% of consumption occasions, with consumers citing physical or mental refreshment (7%), a cooling effect (4%), and thirst relief (4%). This need state positions energy drinks as a functional alternative to water or soft drinks in hot, active, or outdoor moments.
Unlocking growth in the African energy drinks market with consumer insights
Energy drinks in Africa are primarily a personal, daytime product consumed at home or at work, driven above all by the need for an energy boost. But the data also reveals meaningful secondary territories (relaxation, self-improvement, and refreshment) that create room for brand differentiation and portfolio segmentation.
For a full picture of the category, Sagaci Research’s complementary tools each add a distinct layer of insight. SagaCube tracks consumption patterns and need states in real time across 54 markets. SagaBrand measures brand health and equity across the energy drinks competitive set, while SagaProduct delivers SKU-level data on formats, pricing, and retail availability.
Together, these tools give brands the consumer intelligence needed to compete effectively in one of Africa’s fastest-growing beverage segments.
For a broader market context, the category’s growth trajectory is explored in our earlier analysis of the energy drinks market in Africa.
Download the report to explore the full insights.
Methodology
Energy drinks consumption in Africa and need states survey leveraging Sagaci Research’s proprietary online panel in Africa covering all countries on the continent, with the SagaCube consumption tracker.
Questions:
- From the list of beverages below, please select everything you drank yesterday.
- From the list below, which one is your preferred energy drink flavour?
- What day of the week were you drinking energy drinks?
- What time of day did you have energy drinks?
- Where were you when you had energy drinks?
- Who were you with when you were drinking energy drinks?
- Generally, why did you decide on drinking energy drinks? And more specifically…?
Population: Adults over 18 in 54 African countries
Bases:
- Beverage penetration: 548,061 respondents (ongoing since Q3 2025)
- Consumption occasions: ~73,600 respondents (ongoing since Q3 2025)
- Need states: 73,607 respondents (ongoing since Q3 2025) / deeper need states: 53,926 respondents
- Flavour preference: 73,880 respondents (2023–2026)
- Format (product scans): 1,300+ unique products scanned via SagaProduct (2025 to date)