

- 29/01/2026
- Posted by: Xavier Bes
- Category: Reports
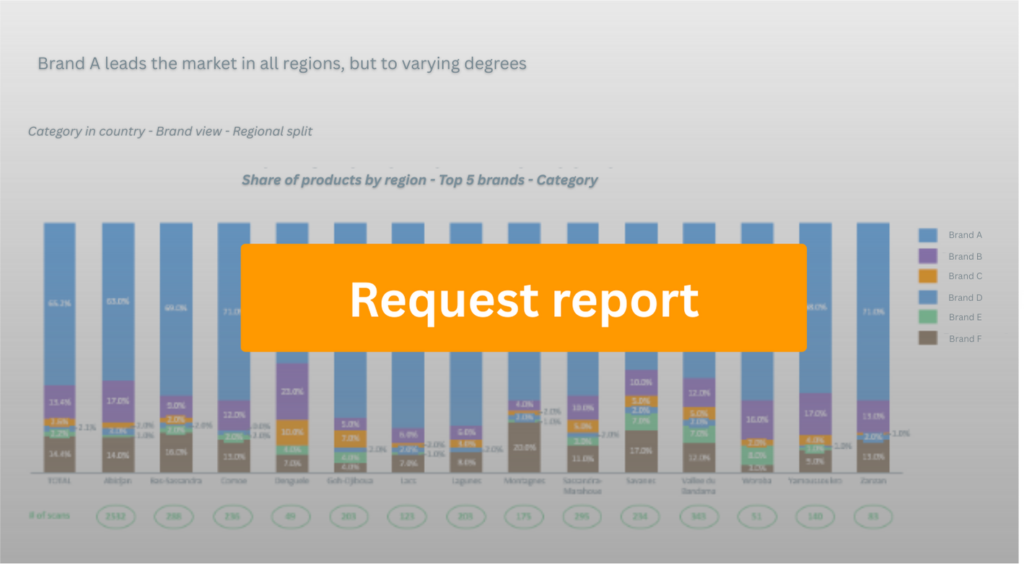
Detailed insights on the non-alcoholic beverages market in Burkina Faso
Explore in-depth insights into the non-alcoholic beverages market in Burkina Faso, drawn from real consumer data. This market report analyzes key consumption trends, top non-alcoholic beverages brands, packaging preferences, and shopper behaviour within the non-alcoholic beverages category. Built from our proprietary data tools, it provides a detailed look at market dynamics, product performance, and evolving consumer choices across the non-alcoholic beverages landscape in Burkina Faso.
Here is the type of information included in this report:
- A total of 1,017 non-alcoholic beverages products (SKUs) have been scanned by consumers in Burkina Faso, providing a comprehensive view of the category
- These products span 383 different non-alcoholic beverages brands
- The most common pack size in the non-alcoholic beverages category is 35 cl, with the Plastic Bottle format being the most frequently used
- In the past 12 months, 45,880 new unique product entries have been recorded in the non-alcoholic beverages category
- Lafi is currently the most scanned non-alcoholic beverages brand in Burkina Faso
Report on the non-alcoholic beverages category in Burkina Faso
Order your report today to access a comprehensive picture of this category and identify growth opportunities.
Related non-alcoholic beverages categories
- Beverages
- Alcoholic Beverages
- Bottled Water
- Carbonated Soft Drinks
- Coffee
- Energy Drinks
- Flavoured Powder Drinks
- Juices
- Tea
Regions in Burkina Faso covered in the report
- Boucle du Mouhoun
- Cascades
- Centre
- Centre-Est
- Centre-Nord
- Centre-Ouest
- Centre-Sud
- Est
- Haut-Bassins
- Nord
- Plateau-Central
- Sahel
- Sud-Ouest
Other types of non-alcoholic beverages insights available
- Top non-alcoholic beverages products in Burkina Faso overview (brand, format, size in units, price, etc)
- Share of products by demographics (gender, age, SEC, regions) evolution
- Share of non-alcoholic beverages brands in Burkina Faso by demographics
- Non-Alcoholic Beverages brand shopper profile
- Average consumer rating per non-alcoholic beverages product / brand
Methodology
Our report draws on the SagaProduct database, which tracks the actual non-alcoholic beverages products consumers in Burkina Faso are purchasing and consuming.
Online panel members from Burkina Faso scan non-alcoholic beverages products on a daily basis with our dedicated app to capture features such as SKU details (category, brand, format, size, unit), barcode, picture, etc.
To obtain detailed insights on the non-alcoholic beverages sector in Burkina Faso, get in touch on contact@sagaciresearch.com or click below.
