

- 29/01/2026
- Posted by: Xavier Bes
- Category: Reports
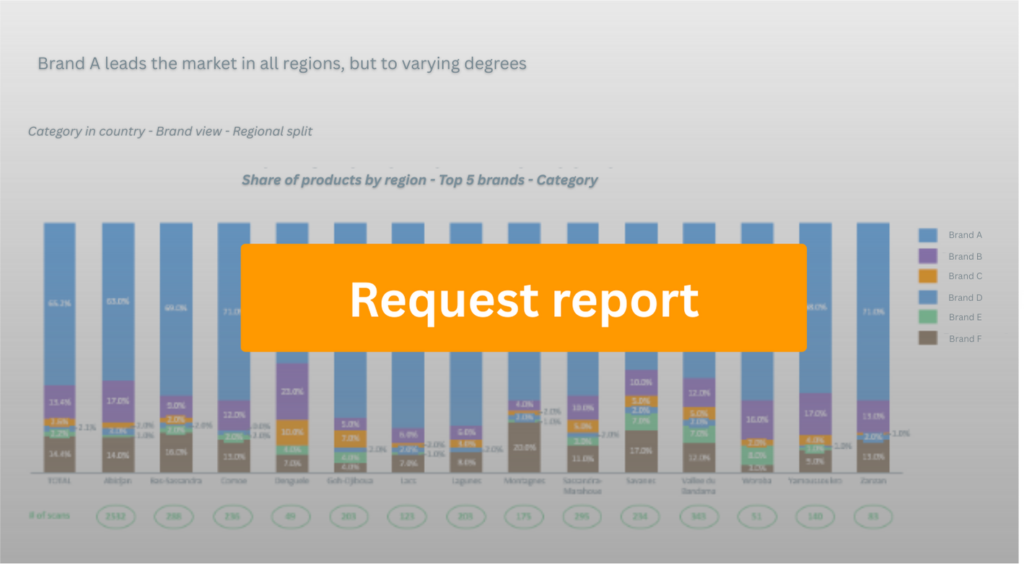
Detailed insights on the juices market in Kenya
Explore in-depth insights into the juices market in Kenya, drawn from real consumer data. This market report analyzes key consumption trends, top juices brands, packaging preferences, and shopper behaviour within the juices category. Built from our proprietary data tools, it provides a detailed look at market dynamics, product performance, and evolving consumer choices across the juices landscape in Kenya.
Here is the type of information included in this report:
- A total of 621 juices products (SKUs) have been scanned by consumers in Kenya, providing a comprehensive view of the category
- These products span 118 different juices brands
- The most common pack size in the juices category is 1 l, with the Plastic Bottle format being the most frequently used
- In the past 12 months, 64,983 new unique product entries have been recorded in the juices category
- Minute Maid is currently the most scanned juices brand in Kenya
Report on the juices category in Kenya
Order your report today to access a comprehensive picture of this category and identify growth opportunities.
Related juices categories
- Non-Alcoholic Beverages
- Bottled Water
- Carbonated Soft Drinks
- Coffee
- Energy Drinks
- Flavoured Powder Drinks
- Tea
Regions in Kenya covered in the report
- Baringo
- Bomet
- Bungoma
- Busia
- Elgeyo-Marakwet
- Embu
- Garissa
- Homa Bay
- Isiolo
- Kajiado
- Kakamega
- Kericho
- Kiambu
- Kilifi
- Kirinyaga
- Kisii
- Kisumu
- Kitui
- Kwale
- Laikipia
- Lamu
- Machakos
- Makueni
- Mandera
- Marsabit
- Meru
- Migori
- Mombasa
- Murang’a
- Nairobi
- Nakuru
- Nandi
- Narok
- Nyamira
- Nyandarua
- Nyeri
- Samburu
- Siaya
- Taita Taveta
- Tana River
- Tharaka-Nithi
- Trans Nzoia
- Turkana
- Uasin Gishu
- Vihiga
- Wajir
- West Pokot
Other types of juices insights available
- Top juices products in Kenya overview (brand, format, size in units, price, etc)
- Share of products by demographics (gender, age, SEC, regions) evolution
- Share of juices brands in Kenya by demographics
- Juices brand shopper profile
- Average consumer rating per juices product / brand
Methodology
Our report draws on the SagaProduct database, which tracks the actual juices products consumers in Kenya are purchasing and consuming.
Online panel members from Kenya scan juices products on a daily basis with our dedicated app to capture features such as SKU details (category, brand, format, size, unit), barcode, picture, etc.
To obtain detailed insights on the juices sector in Kenya, get in touch on contact@sagaciresearch.com or click below.
